4.3. Variance outputs
The arburg() function returns the AR parameters but also an estimation of the variance.
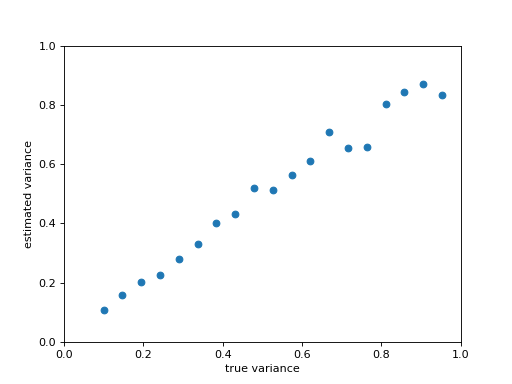
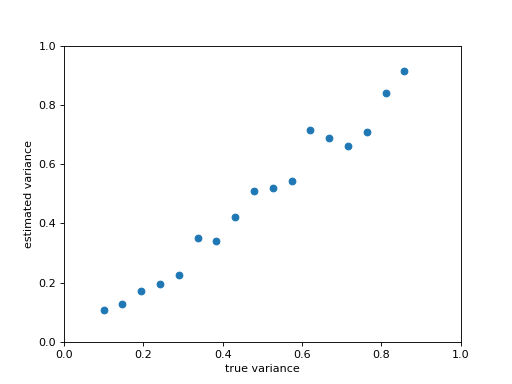
The following example plots the estimated variance (using arburg function) versus the true variance for different values of variance. In other words, we plot how accurately the variance can be estimated.
from pylab import plot, xlabel, ylabel, plot, axis, linspace, randn
import scipy.signal
from spectrum import arburg

# Define AR filter coefficients
a = [1, -2.2137, 2.9403, -2.1697, 0.9606];

# for different variance,
true_variance = linspace(0.1, 1, 20)
estimated_variance = []
for tv in true_variance:
    x = scipy.signal.lfilter([1], a, tv**0.5 * randn(1,256))
    AR, v, k = arburg(x[0], 4) # we estimate the AR parameter and variance
    estimated_variance.append(v)

plot(true_variance, estimated_variance, 'o')
xlabel('true variance')
ylabel('estimated variance')
plot([0,0],[1,1])
axis([0,1,0,1])
(Source code, png, hires.png, pdf)