Note
Go to the end to download the full example code.
spectrogram
Context
Example
In the following example, we compute and plot a spectrogram from a signal emitted by a dolphin to see the time-frequency components
from spectrum import Spectrogram, dolphin_filename, readwav
data, samplerate = readwav(dolphin_filename)

p = Spectrogram(data, ws=128, W=4096, sampling=samplerate)
p.periodogram()
p.plot()
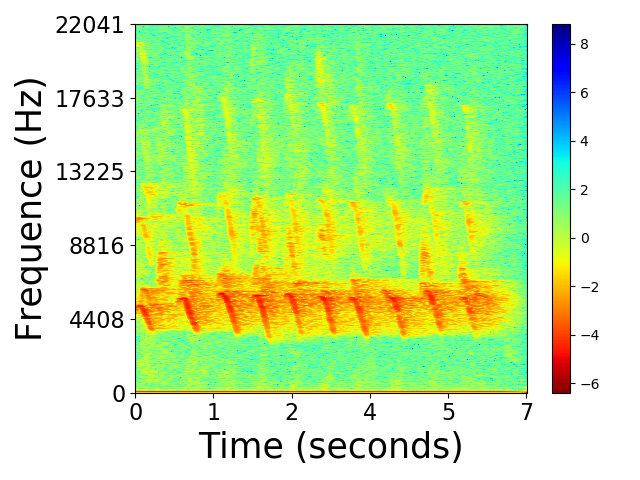
Duration: 7.116961451247166
W: 4096
ws: 128
Computing 1226 TFs
done
Total running time of the script: (0 minutes 1.493 seconds)