Note
Go to the end to download the full example code.
pyule
Context
Example
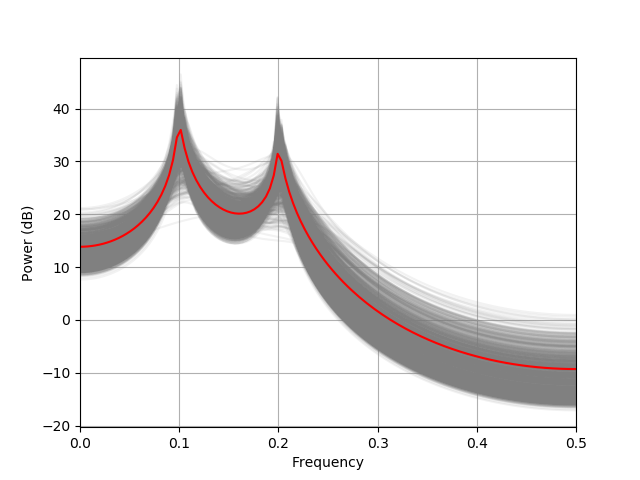
In the following example, we use pyule to analyse 1000 noisy signals. We plot them in gray and the average in red.
from spectrum import pyule
from scipy.signal import lfilter
from pylab import plot, mean, log10, randn
from numpy import array
allpsds = []
a = array([1,-2.2137,2.9403,-2.1697,0.9606])

for this in range(1000):
    x = lfilter([1], a, randn(1,256))
    p = pyule(x[0],4, scale_by_freq=False, NFFT=256)
    p.plot(color='gray', alpha=0.1)
    allpsds.append(p.psd)

plot(p.frequencies(), 10*log10(mean(allpsds, axis=0)), "red")
[<matplotlib.lines.Line2D object at 0x7fe690833b60>]
Total running time of the script: (0 minutes 1.621 seconds)